Meteorology knowledge

The atmosphere is the densest part of the gaseous covering that envelops our planet. Due to its weight and to the property that gases have of being compressible, the whole atmosphere is in a state of hydrostatic equilibrium: this determines a horizontal stratification, in concentric ‘strata’, of the surfaces having not only a constant pressure (isobaric surfaces) and density, but also other magnitudes such as temperature, humidity or degree of ionization. The layers which are of greater interest to meteorology are the troposphere and the tropopause. Together they reach a width of about 26 km: it is here that all meteorological phenomena take place.
The main atmospheric parameters that must be known to study meteorological events are the amount of thermal energy that reaches the Earth (the temperature of the ground and of the air), atmospheric pressure and the humidity contained in the air.
Related topic

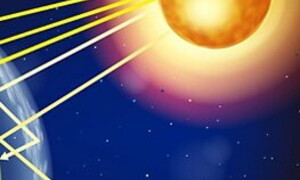
Energy from the Sun
A great quantity of heat reaches the Earth from the Sun, through the layers of the atmosphere. Only a part of solar radiation reaches the Earth’s surface: 34% of solar radiation is reflected into space by the atmosphere, by clouds and by the Earth’s surface itself. Of the remaining 66%, 19% is absorbed by water vapour, by clouds and by the ozone layer and only 47% on average is absorbed by the Earth’s surface. Solar energy reaches the ground largely in the form of ultraviolet rays, that pass through the atmosphere easily and are subsequently absorbed by the ground.
Atmospheric pressure
On Earth, atmospheric pressure is equal to the weight of the air column that ‘weighs’ on the Earth’s surface. This is true at any altitude, but 99% of the atmosphere’s mass is concentrated in the first 32 km. Pressure variations at sea level do not usually exceed 4% of the normal average value (that is 1013 millibar): lower values (up to 900 millibar) can be registered in the eye of tropical cyclones. With the exception of some small local variations, atmospheric pressure and density decrease with altitude following an exponential curve up to a level of about 100 km, where they reach a value equal to one millionth of the value at sea level.
Temperature: hot zones, cold zones
The minimum temperature of the Earth’s surface is registered at dawn, the maximum temperature between 3.00 p.m. and 4.00 p.m. The mathematical average of the two figures gives the average daily temperature. From the average of the daily temperatures in one month, the monthly average is obtained and from the average of these monthly averages, the average annual temperature is calculated. The annual average temperature of the Earth’s surface is about 15°C, but local variations are considerable, with a wide range of daily and seasonal temperatures and significant differences from one point of the Earth to another.
Many factors
Temperature also depends on many other factors such as altitude, the position of the emersed land and of the surrounding seas, exposure to the sun, vegetation covering the soil, prevailing winds, the characteristics of the land etc. In particular, since it depends mainly on the irradiation of the earth, temperature diminishes with altitude, with an average vertical gradient of about 0.6°C every 100 m higher you climb: it is for this reason that the higher the altitude, the lower the temperature.
The vertical thermal gradient
Air temperature decreases by about 0.6°C every 100 m you climb, a value that may be considered the normal thermal gradient in the lower strata of the atmosphere, but that can register local variations. In particular, when air masses move vertically, a new situation can arise in which there is imbalance with the surrounding air temperature, determining anomalous zones that are either colder or warmer. At times situations of so-called thermal inversion can take place when the temperature, instead of decreasing, increases with altitude.
Isobars e isotherms
In order to indicate the pressures and temperatures of the atmosphere at ground level and at high altitudes in various parts of the Earth, special charts are created. The Isobar chart or Pressure chart, shows the pressure distribution. From the Greek words isos, equal and baros, weight, having an equal pressure, isobars are lines that join together points having an equal atmospheric pressure, analogously to the isohypse contour lines (to indicate equal altitudes) that are used to show the mountains on a topographical map.
Humidity
Atmospheric humidity is the amount of water vapour contained in the air. It represents a very small percentage of the water present on Earth (about 0.01%), but it is very important for the role it plays in the water cycle. It is in fact through atmospheric humidity that water moves, passing from oceans and seas to dry land: nearly all the water vapour that is present in the atmosphere originates from the evaporation of the ocean and sea waters and the contribution of continental sheets of water and evapotranspiration of the land and vegetation is very small.
Precipitation includes all forms of additional water, in the liquid or solid state, that fall or form on the Earth’s surface. They can be subdivided into direct precipitation, such as rain, snow and hail and occult precipitation, such as dew and frost, that do not derive from clouds but form directly on contact with the Earth’s surface.
Liquid precipitation, or rain, takes place when drops of water present in a cloud grow bigger and bigger until they are too heavy to remain in the cloud and therefore fall to the ground. The mechanisms by which the cloud drops grow bigger are several: by absorbing water in an over-saturated atmosphere or, specially by coalescence, that occurs when drops collide against each other on falling.
The limit that separates cloud drops from rain drops is around 100 micron, but generally rain drops are much bigger, at times greater than 2000 micron.
Related topic
Snow
Snowflakes are an aggregation of ice crystals formed from vapour condensing within clouds at a temperature below 0°C. Contrary to what you might think, water vapour and low temperatures are not the only conditions needed to form ice crystals. Dust particles are crucial for this process, as water vapour molecules form around them aggregating to create crystals. A newly-formed ice crystal arranges into a column-shaped hexagonal structure.
Hail
Connected to thunder clouds, hail is made up of practically spherical masses of ice. Each hailstone is made up of hundreds of ice crystals, in alternate transparent and translucent layers due to the presence of air bubbles. The transparent crystals form slowly in the inferior portion of a cumulonimbus, that is characterized by higher temperatures, while the opaque crystals are typical of the superior portion, where the lower temperatures cause the rapid formation of crystals that trap air bubbles as they grow.
Fog
Fog is a sparsely dense not very thick layer of cloud that forms on contact with the ground in particular meteorological conditions. Generally the drops of water in a fog are smaller and less numerous than in a cloud, for this reason fogs are less dense and more transparent than clouds. Fogs form when there is a difference in temperature between the ground and the air above it. Radiation fog forms after sunset, when the temperature of the ground decreases, provoking a slow cooling also of the air above.
Dew and frost
When the ground, dispersing heat by radiation, reaches dew point, the air that is directly in contact with it, condenses and deposits drops of water directly on the ground, and on all the surfaces the air comes into contact with, thus forming dew.
Dew supplies a quantity of water that can be important in some particular situations: where there is no direct precipitation, the vegetation however receives an amount of water that is sufficient for its vital processes.
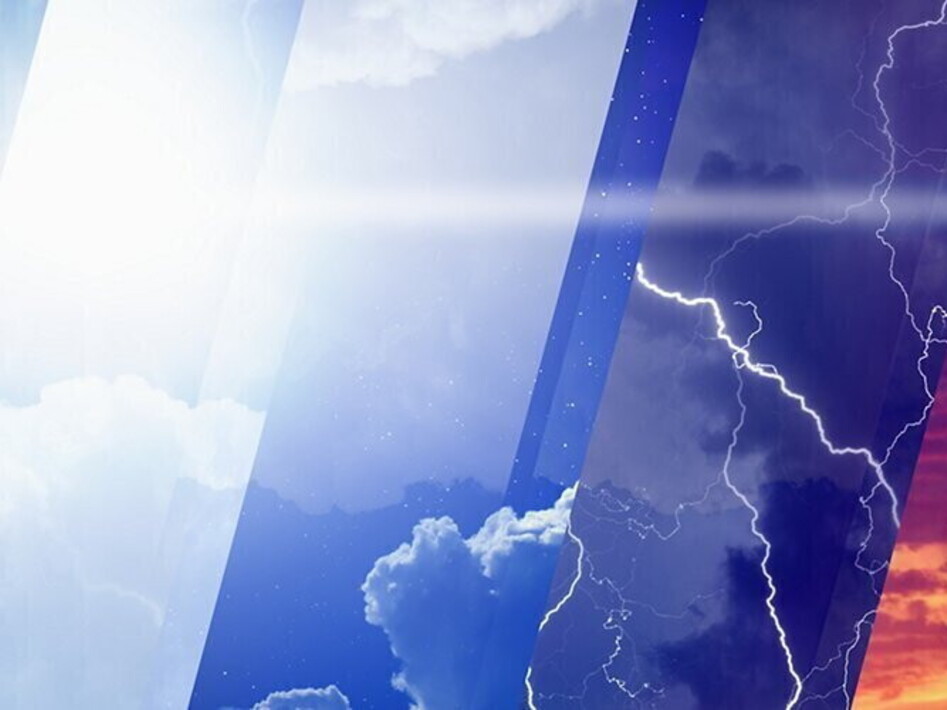
The weather
Weather, from a meteorological point of view, indicates the set of atmospheric phenomena that take place at a particular moment in a part of the Earth. Some phenomena have a strictly local influence, limited to extremely restricted areas, while others involve entire regions. Atmospheric phenomena are characterized by great variability and small local variations can contribute in making the weather evolve into situations completely different from those foreseen.
Fronts
A front in a meteorological sense is the zone of contact between air masses with different density, temperature and humidity. The frontal band is the area in which two air masses come into direct contact, the area in which energy exchanges take place and where the more intense atmospheric phenomena are produced. Generally, a front appears as a more or less regular surface, with a low angle, slightly inclined, and it generally forms a curved line on the horizontal plane. Meteorologists identify three types of fronts: cold, hot and occluded.
Storms
Perturbations that bring storms are formed when there is a collision between two air masses at different temperatures or when the excessive heating of the ground, along with a high level of humidity, brings about the formation of masses of warm, humid air. The mechanism is the same as that which leads to the formation of fronts and cloud systems (ascent, cooling and condensation), but owing to the great differences in temperature, the phenomenon is more intense and ‘energetic’.
Cyclones and hurricanes
Around low pressure areas, air circulation generates a depression vortex called a cyclone. The circumstances that lead to the onset of a cyclonic circulation are always the same: the low pressure centre attracts air from the surrounding areas with an anticlockwise movement in the Northern Hemisphere and a clockwise movement in the Southern Hemisphere. But cyclones are not all the same. Why are some violent and unexpected, real catastrophes? Why do some last for months? Why are others relatively ‘calm’ and do not cause damage?
Tornadoes
Tornadoes form evolving from cumulonimbus storm clouds when the atmospheric conditions are particularly humid. They begin with the downward shear of a part of the cloud, thus forming a funnel-shaped cloud that is the first sign of the birth of a tornado. The funnel cloud descends gradually towards the ground: if it reaches the Earth’s surface, it becomes a tornado. The dimensions of the funnel cloud are indicators of the strength of the tornado, and range from 15 m to a couple of kilometres in diameter.
Whirlwinds
Whirlwinds are similar to tornadoes, but are decidedly smaller and with less energy. When they evolve from storm clouds, they behave like small tornadoes and can be quite destructive. Whirlwinds, also called dust devils, with smaller dimensions and minor energy, usually form in very warm and dry air conditions in desert regions or in the plains and are not associated with clouds or precipitation. These vortices are triggered off by convective phenomena caused by intense heating of the ground.
A thunderstorm breaks
The main atmospheric phenomenon associated with a thunderstorm is surely the rain, that often arrives in the form a sudden violent downpour. It has been calculated that only 20% of the humidity accumulated in the thundercloud is actually returned in the form of rain. Often precipitation may take the form of hail, that forms when the temperatures inside the cloud allow the formation of ice crystals. Also the wind is a phenomenon that can have a particularly violent nature during a storm, and it can evolve, at times, into a tornado or hurricane.
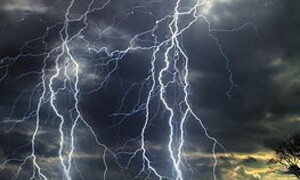
Lightning
Lightning is one of the most typical and characteristic manifestations of thunderstorms. Lightning is visible in the form of electric discharges that originate from the thundercloud and hit the ground, however the phenomenon is much more complex, and since it takes place at the speed of light, it is so rapid that we are unable to understand it immediately. Lightning is an electric discharge inside a storm system. Lightning can occur within a cloud, between adjacent clouds, or between the clouds and the ground.
Thunder
The main atmospheric phenomenon associated with a thunderstorm is surely the rain, that often arrives in the form a sudden violent downpour. It has been calculated that only 20% of the humidity accumulated in the thundercloud is actually returned in the form of rain. Often precipitation may take the form of hail, that forms when the temperatures inside the cloud allow the formation of ice crystals. Also the wind is a phenomenon that can have a particularly violent nature during a storm, and it can evolve, at times, into a tornado or hurricane.
The rainbow
Lightning is one of the most typical and characteristic manifestations of thunderstorms. Lightning is visible in the form of electric discharges that originate from the thundercloud and hit the ground, however the phenomenon is much more complex, and since it takes place at the speed of light, it is so rapid that we are unable to understand it immediately. Lightning is an electric discharge inside a storm system. Lightning can occur within a cloud, between adjacent clouds, or between the clouds and the ground.
The weather station is a small construction in which all the instruments used to measure the principal atmospheric parameters are set up. It is a wood cabin, painted white in order to reflect the Sun’s rays in the best possible manner, the sides are louvered shutters in order to guarantee air circulation. The cabin must be placed 1 m above ground so that it is not affected by direct heating from the ground. Many instruments are lodged in the cabin: a thermometer to measure the temperature, usually the maximum and minimum temperature type, a barograph and, on the outside, an anemometer and an anemoscope and a pluviograph are the minimum standard instrumentation.
The weather station must operate even if an operator is not present on the site, therefore all the instruments must be able to record data. Once, recordings were made on paper supports, and the operators periodically replaced the rolls of paper and collected the data, but now most of the instruments are electronic and are able to record data continuously, transfer them to a computer, and transmit them in real time to the recording stations, usually by means of radio signals.
Related topic
The barometer
The most precise and accurate instrument to measure pressure is the mercury barometer, on the model of E. Torricelli’s barometer invented in 1643. The aneroid barometer is less precise, however it is smaller and easier to use. It consists of a metal container in which a forced vacuum is created and sealed with a light flexible metal cover that rises and falls with variations in the external pressure. The movements of the cover are transformed by a mechanism into movements of a needle along a measuring scale that indicates the value of the atmospheric pressure.
The thermometer
The most commonly used thermometer is the mercury thermometer in which the temperature is measured on the basis of the expansion of liquid mercury in a bulb, however also ethyl alcohol thermometers are used. The thermograph that enables the recording of temperatures over a period of time is more complex: generally it consists of a bimetallic lamina, in which two different metals, that are welded together expand differently with the same variation in temperature.
The hygrometer
Relative humidity is measured with instruments called hygrometers. The most widespread are the hair type hygrometer, that exploit the unique property of human hair to stretch proportionally with the relative humidity (as those who have curly hair well know, when the air is humid, hair becomes more curly and knotted). In meteorology more precise instruments called psychrometers (from the Greek word psycros, cold) are used.
The rain gauge
The amount of water that falls on the ground is expressed in millimetres, i.e. the height the water would have reached had it fallen on a horizontal impermeable surface. One millimetre of rain that falls on a surface of 1 m2 is equivalent to one litre of water collected. The amount of rain that falls is measured with pluviographs. These consist of a cylinder shaped container, positioned in a special weather cabin, above which is a collection funnel that has standard characteristics.
The anemometer
Wind speed is expressed in km/h or knots (1 knot = 1.852 km/h), or, more rarely in meteorology, with the Beaufort scale (proposed in 1805 by the English Admiral Francis Beaufort, to classify the winds according to their intensity). Anemoscopes measure the direction of the wind and consist of simple metal vanes that rotate on a pivot and align with the direction of the wind (like the weathercocks on the roofs of houses or windsocks in the airports, that also provide an estimate of the speed of the wind depending on how the sock expands).
The heliograph
Insolation is when the Sun shines above the horizon on a given point of the Earth. This is measured by means of a helio-phano-graph, which consists of a spherical lens that concentrates the Sun’s rays on to a strip of special thermal paper that blackens when hit by the Sun’s rays that have been concentrated by the lens. The energy received from a given surface, instead, is called global radiation, and is measured with an instrument called pyranometer or solarimeter, and is expressed in calories per unit of time per surface unit.
The capacity of making weather forecasts has always been one of Man’s requirements, in order to be able to manage and plan all his activities, from his leisure time to sports, to agricultural activities and industrial activities in the open air.
Nowadays our knowledge about the weather and meteorological phenomena has greatly improved, even though we are far from totally comprehending them, and consequently, weather forecasts are increasingly reliable. In Italy the official body in charge of formulating the weather forecasts is Servizio Meteorologico dell’Aeronautica Militare, the Meteorology Service of the Military Aeronautic Service, in collaboration with the European and World Meteorological Organization.
The Meteorology service publishes the official Meteorology Bulletin daily, making use of the data collected in the stations on ground (positioned in all the airports and integrated by other stations scattered around the national territory). Some of these are equipped with instruments for radar monitoring and for launching probe balloons. The data are then integrated with the recordings carried out by the world network of meteorology satellites, in particular by the European METEOSAT satellites.
For short term forecasts, with indications that are valid up to 12-24 hours, ground level and high altitude synoptic weather charts are used. For this type of forecasts, the experience and personal capacity of the meteorologist are still fundamental. Therefore these are very subjective forecasts, and their reliability depends greatly on the meteorologist’s ability. For mid-term forecasts, valid up to a maximum of 3-5 days, mathematical-numerical methods are prevalently used. In this case the forecasts are based on a mathematical model of the atmosphere, that represents a state of the weather with a series of equations in which the unknown values are the temperature, pressure, air density and wind-speed. These methods require the use of very powerful and rapid calculators because simulation requires an enormous number of calculations. The evolution of high power computers for civil purposes has taken place, as a result of the research to satisfy the need to carry out calculations in the meteorological field.
For long term forecasts, that are valid from a week to a month, instead, statistical analyses are used, based on series of meteorological data over a period of time. In practice the mean conditions of the weather in the past are studied in order to foresee the possible behaviour of the weather in analogous meteorological conditions. This type of study is more suited to study the climate than to solve the problems of weather forecasts.
Related topic
Global network
On ground level, meteorological observations are carried out by a network of over 10,000 stations distributed all over the Earth’s surface, to which we must also add the numerous mobile stations on ships and aircraft that are equipped for the purpose. The main observations are pressure, temperature, air humidity, direction and speed of the wind, precipitation, clouds. The more important stations also measure insolation, the sun’s radiation, evaporation and ground temperature.
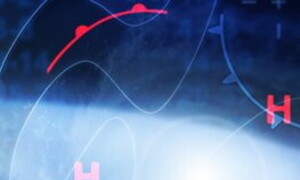
What is a weather chart?
Weather charts are the fundamental basis for weather analysis and forecasts. They are based on the data collected by weather stations on the ground and on the data recorded at high altitudes by probes and satellites. Most modern instruments are able to guarantee a continuous recording of atmospheric data, but the weather charts are created using the data recorded at preset conventional timings, so that they may be comparable with one another in different locations around the world.
Interaction with the oceans
The atmosphere, with its movements and the phenomena that take place, is not an isolated and independent system but it is affected by the interaction and exchange of energy with the hydrosphere, the lithosphere and the biosphere. In particular it is not possible to understand the mechanisms governing the behaviour of the atmosphere without studying its relation with the oceans. The oceans with their enormous volumes of water, form an immense “heat container” that stores very large quantities of thermal energy absorbed from solar radiation.
Cities and local climate
Anyone who lives in suburban areas and works in the city has surely experienced the differences in the climate of large urban conglomerations compared to the climate in zones that are far from the city. Cities are generally much warmer than the surrounding areas, besides being more polluted, and in the winter months the conditions for thermal inversion are often present. In other words, large cities seem to modify local climatic conditions. What is this phenomenon due to?
A global climatic model
Man has always tried to understand the climate and make forecasts on the weather. For agricultural activities, for travel, for transportation, weather forecasts are indispensable in order to plan human activities, but also for the realization of housing, roads, bridges that must resist against the most adverse weather conditions. It is difficult for us to understand a complex system such as the climate on a planetary scale.